Group analysis
Sice uur aim in interpreting this dataset is to extrapolate the findings to the entire population from which the sample was taken. To put it another way, if we see changes in brain function in our study, can we assume that these changes will be observed in the general population? We’ll run a group-level review to see if this is true (second-level analysis). This means that in SPM, we compute the standard error and mean for a contrast estimate before determining if the average estimate is statistically important. This group-level study will be conducted using a summary statistic method that ignores parameter estimate uncertainty and conducts a t-test on the mean parameter estimates from each subject.
Specifying the 2nd-Level Analysis
We need to create a new directory to store the 2nd-level findings after you’ve completed all of the 1st-level analyses. Navigate to the BART directory containing all of your subjects and type mkdir 2ndLevel cash-explode from the terminal.
Select the button Specify 2nd-level from the SPM GUI. The default test will be a one-sample t-test, and there are only two fields to fill in: the output directory for the results, and the scans you’ll be
testing on - in other words, the contrast images generated during each 1st-level study.Select the 2ndLevel cash-explode folder we just created from the Directory field. Go to the 1stLevel directory
of sub-02 and select the cash-explode contrast image, con 0001.nii, for the Scans sector. Select the con 0001.nii for each subject from the 1stLevel folders of the rest of other subjects.
After you select all the images, click the green “Go” button when you’ve done selecting the con 0001.nii for all 14 subjects(exclude the sub-01 and sub-09).

Note
Remeber we have set the 4 different contrasts from cash-explode, explode-cash, cash and explode. If you forget the contrast conditions, you can load the SPM.mat file for a sample subject via the
Results button from SPM GUI and see which number contrast corresponds to the con images produced in each subject’s folder.
Estimating the 2nd-Level Analysis
It will only take a second to specify the model. You’ll need to estimate the model after it’s done, just as we did with the first-level analyses. Click the Estimate button in the SPM GUI and the
green “Go” button after selecting the SPM.mat file from the 2ndLevel Flanker directory you created.

Viewing the Results
We can now display the findings by selecting the Results button from the SPM GUI, just as we did with the 1st-level analyses. Click Done after selecting the SPM.mat file from the 2ndLevel
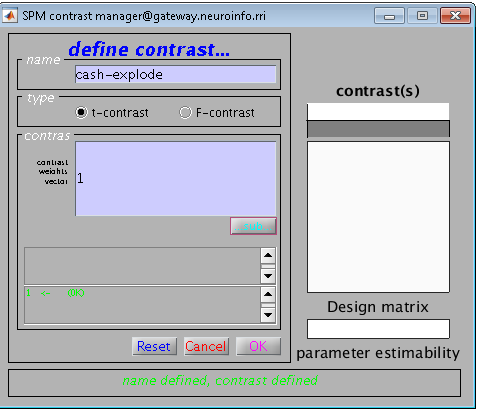
cash-explode directory. Another contrasts window will appear, but with a small difference: This design matrix resembles a white box, while the first-level studies had a design matrix that included all of
the regressors in the model. That means there’s only one regressor to test: the mean activation over all of the individual contrast images used in the model. Click Define new contrast, name the contrast
“cash-explode”, and give it a contrast weight of 1. When you are finished, it should look like this:

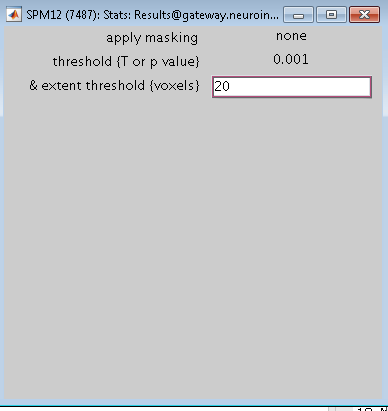
Click OK, and then click Done. You will be asked the same questions as before about masking, cluster-thresholding values, and cluster extent. For this group analysis, select the following:
apply masking -> none
p value adjustment to control -> none
threshold {T or p value} -> 0.001
& extent threshold {voxels} -> 20
The image will be thresholded to only display clusters made up of individual voxels that each pass a 0.001 threshold.
When you are finished, you should see output like this, showing a significant cluster:

2nd-Level Results for cash and explode
If you’re only interested in the areas where the cash and explode contrasts are vary significantly, the measures above are all you’ll need to do. As an exercise, create a second-level result for the explode-cash, cash and explode contrasts respestively. If you examine the cash and explode results at the same threshold, do you see what you would expect given the cash-explode contrast that you viewed above?
Note
Just a hint for you, the cash contrasts are located in the con 0003.nii file for each subject, and the explode contrasts are located in the con 0004.nii file for each subject, using the same method as
above for deciding which contrast is located in the SPM.mat file. Starting with the cash contrast image, go to the SPM GUI’s Specify 2nd-Level button and select the 2ndLevel cash folder for the Directory input. Select the con 0003.nii images for each subject using a method similar to the one described above.
When you have finished creating all of the second-level analyses, try the remaining exercises to test your understanding of what you have just learned.