Functional connectivity
Resting-state fMRI
Resting-State Functional Connectivity (RSC) is a kind of study that indicated the significant correlation of signal between functionally related brain regions in the absence of any stimulus or task stimulus or task. This correlated signal arises from spontaneous low-frequency signal fluctuations (SLFs). A lot of the time series of voxels correlated significantly (after filtering the fundamental and harmonics of respiration and heart rates) while only a few voxel time courses (< 3%) correlated with those in regions outside of the motor cortex. Subsequently, there are some evidence indicated that the presence of RSC in sensory cortices, specifically auditory and visual cortices. In a study, signal from visual cortex voxels during rest was used as a reference and correlated with every other voxel in the brain. A significant number of voxels from the visual cortex passed a threshold of 0.35, while only a few voxels from outside the visual cortex passed the threshold. some similar results also appear in the auditory cortex.
The history of Resting-State Functional connectivity
Experiments with fMRI focused primarily on mapping the BOLD response to sensory and motor stimuli as neuroimaging became more widely employed in the early 1990s. The reaction of the visual cortex to a flashing checkerboard, for example, was observed early on (Kwong et al., 1992), as were the responses of the primary sensory areas to auditory, tactile, and finger pressures. These tests were simple, but they were crucial for proving the validity of fMRI as a non-invasive imaging technology.
With these preliminary findings, researchers began looking into the source of the BOLD signal as well as the causes of noise. It was recognised that the signal obtained from the BOLD response was minimal in comparison to the noise that surrounds it; noise generated not only by the scanner itself (in the form of “scanner drift”), but also by physiological causes such as respiration and blood circulation throughout the brain. Bharat Biswal scanned people while they were undertaking a task and while they were not doing a task to better understand these physiological sources of noise.
Even after removing the physiological sources of noise from the resting-state data, Bharat Biswal was surprised to find that they did not account for all of the variance in the BOLD response. Biswal retrieved the time-series from the left motor cortex and correlated it with the time-series of all other voxels after noticing what appeared to be temporal correlations between distinct regions of voxels. There was a high association with the time-series of the opposite hemisphere’s motor cortex, rather than the random correlations that one would predict if there were no regular BOLD fluctuations at rest. In other words, It suggesting that these two functionally equivalent regions generated identical patterns of activity even at rest, though the two areas being spatially separated.
Several other researchers looked into whether these resting-state patterns could be seen in other parts of the brain a few years following Biswal’s finding. Because the motor cortices appeared to be highly associated, it was expected that other bilateral structures, such as the visual and auditory cortex, would also be highly connected. And if these functionally comparable regions were associated during a cognitively demanding task, it was claimed, then other functionally similar regions should be correlated during rest as well.
Note
Biswal employed the left motor cortex as a seed region in this example, which was then linked with all of the other voxels in the brain - commonly known as a whole-brain analysis.
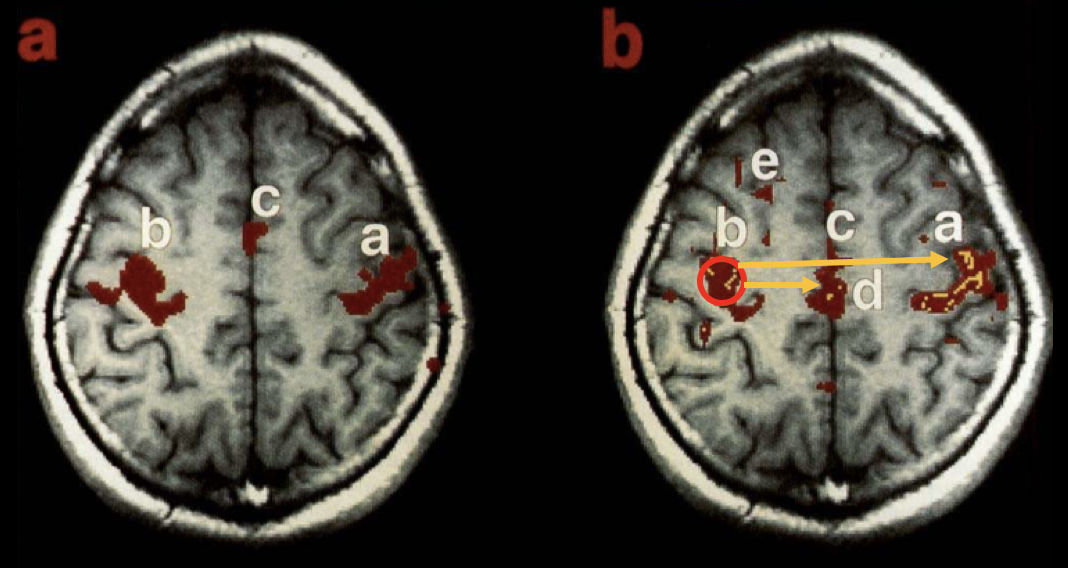
The original Biswal et al. 1995 paper yielded this result. Panel (a) depicts task-related activity in the motor cortices, whereas panel (b) depicts functional connectivity during a resting-state scan, with the left motor cortex serving as a seed region. The task and resting-state images have a lot of overlap, as you can see.
Default-Mode networks
Biswal and other researcher’s study paved the path for neuroimagers to investigate a series of novel theories, including: What would happen to these resting-state patterns if a different seed location was used? What would be the differences in these resting-state patterns amongst groups, particularly clinical populations? What did this mean in terms of treating prevalent mental illnesses? How did these relationships change through time and as people became older?
There was a search for a consistent resting-state pattern that could be related to how people performed during tasks before these questions could be answered. Behavioral disparities between schizophrenics and controls had been demonstrated in basic psychometric tests; however, was this due to, say, visual processing deficiencies or a difference in higher-level cognition?
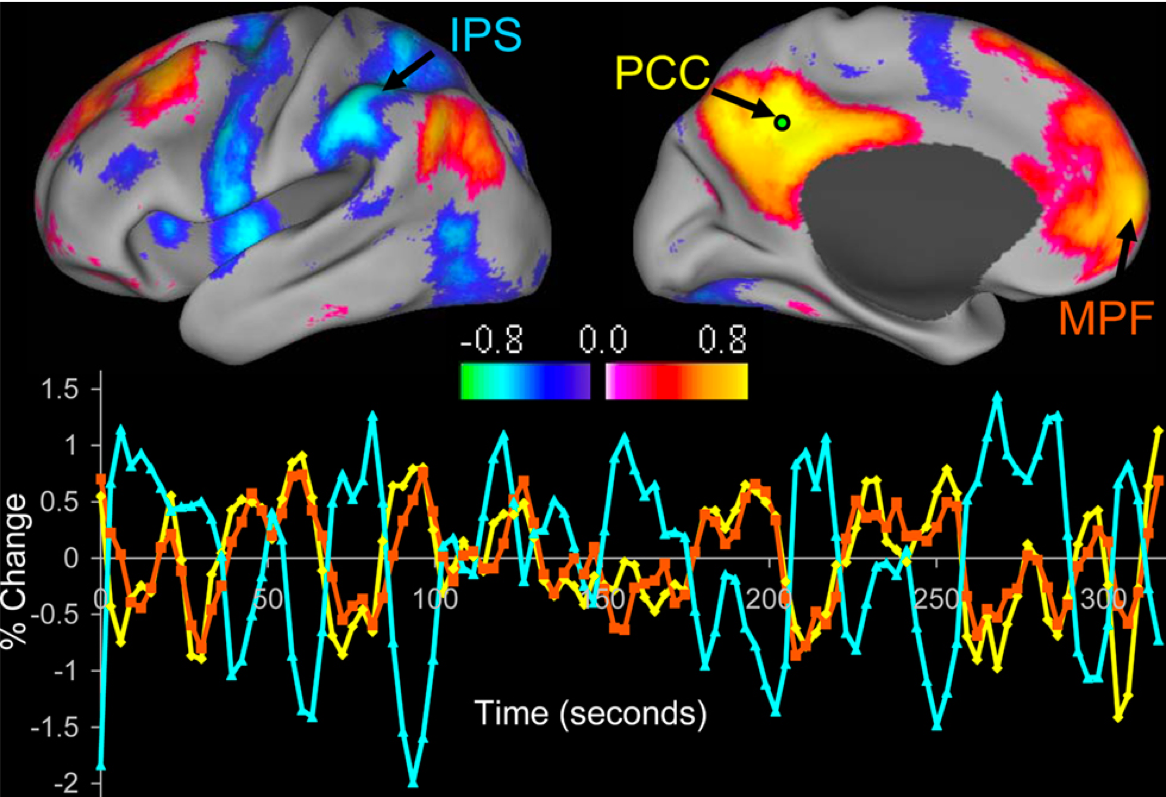
A few years after the Biswal 1995 article, Gordon Shulman and a team of University of Washington researchers discovered that when some brain regions were more active during cognitively demanding tasks, blood flow to other brain regions decreased. This led Shulman to theorise that there may be two networks of brain regions that show inverse blood flow patterns depending on whether or not a task is being performed. To be more specific, the dorsal anterior cingulate and intraparietal sulcus were consistently active during tasks, whether verbal or nonverbal, but the ventromedial prefrontal cortex and posterior cingulate cortex had consistently decreased blood flow during activities, regardless of the type of activity.
Michael Fox and his colleagues didn’t prove that these locations were anti-correlated with one another until nearly a decade later, in 2005: For example, an increase in activity in task-activated regions was linked to a reduction in activity in rest-related regions. The intraparietal sulcus, frontal eye fields, and middle temporal cortex were identified as the task-activated regions’ three major nodes, whereas the medial prefrontal cortex, posterior cingulate cortex, and lateral parietal cortex were identified as the rest-activated regions’ three major nodes. The task-positive and task-negative networks were named after the opposite groupings of nodes.
Those studies found that in order to do a task effectively, there required to be coordination between each of the task-positive nodes - as measured by the amount of correlation between the nodes - as well as a coordinated drop in activity in the task-negative nodes. Different mental diseases, such as schizophrenia and bipolar disorder, could be connected to disruptions in this synchronisation.
Artifacts
Motion Artifacts
As resting-state studies grew more common in the mid-2000s, the right methods for conducting them came under increased scrutiny. Despite Biswal’s demonstration that the BOLD signal fluctuations that underpin resting-state signals are not artefacts, it became clear that resting-state data is particularly vulnerable to certain forms of distortions, particularly motion movement.
Although motion was recognised as an artefact and potential confound for task-related studies from the start, researchers later established that it could lead to erroneous correlations between distinct areas of the brain. In many resting-state investigations of elderly people, correlations between geographically distant nodes like the posterior and anterior parts of the cingulate cortex were shown to be weaker than in younger people. These changes were considered to reflect degradation of the older patients’ brains, similar to how a machine’s screws and pins wear out over time.
Despite the fact that these studies either accounted for motion as a covariate or only included subjects with low amounts of motion, Van Dijk and colleagues (2011) indicated that even little changes between groups could lead to large differences. Subjects were divided into groups based on how much they moved, and there were variations even across groups with mean motions of 0.044 and 0.048. Very modest changes in motion can become the primary source of variance when averaged over large groups of subjects.
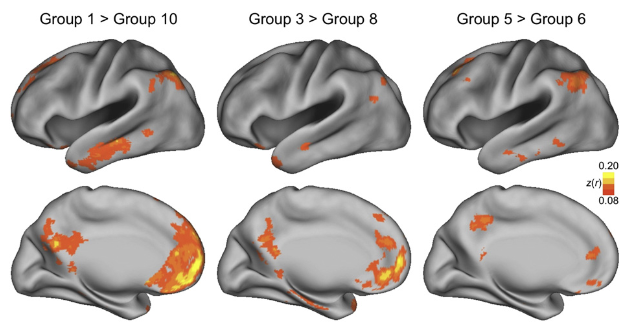
Van Dijk et al. (2011) published this figure in their paper. The difference in average motion between the two groups on the right is only a few thousandths
of a millimetre.
Physiological Noise
The subject’s voluntary motions, such as adjusting the head or scratching an itch, are generally assumed to be the source of motion artefacts. While those are the most obvious, other involuntary actions can have just as much of an impact and are typically more subtle. The two main causes of tiny, involuntary motions that can affect between-group differences are respiration and heart rate. Measuring and regressing these physiological signals helps account for spurious correlations that occur near the arteries or at the brain’s borders, where these artifacts are most visible.
Global Signal Regression
Although movement artefacts have long been regarded a source of noise that must be accounted for, one approach of data analysis, Global Signal Regression, or GSR, has sparked debate since its inception. Fox et al. (2005, described above) investigated anti-correlations between the resting-state and task-positive networks, which was one of the first applications of GSR. Murphy et al. (2007) later demonstrated that GSR produces erroneous negative correlations in voxels. GSR was chosen because it catches noise that isn’t related to neuronal activity, such as breathing, head movement, and scanner drift.